
Posted on May 02, 2016
Center for Earth and Planetary Studies
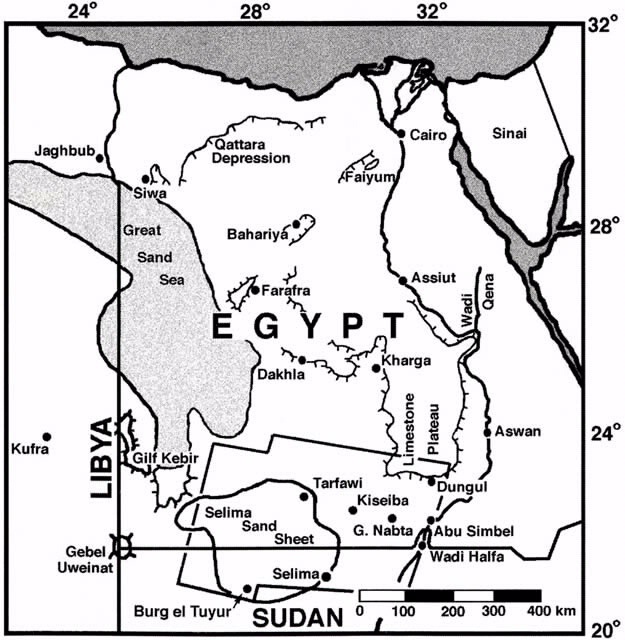
Figure 1: A map of Egypt with the Selima Sand Sheet outlined on the bottom, overlapping the border of Egpyt and Sudan.
The southern region of Egypt where the Selima Sand Sheet is located was wetter and inhabited in the past. Now it is an uninviting monotonous, dry, vegetation-free expanse1. Our research has been twofold, (1) determining the area's landscape evolution, particularly the transition from a wetter environment to the present day sand sheet setting and (2) defining the sand sheet's current rates of erosion and deposition1. Data were collected through a combination of fieldwork and remote sensing.
The Selima Sand sheet makes up more than 120,000 km2 of Darb el-Arba'in Desert1, shown in Figure 1. The sand sheet is made up of sand and granules, with intermittent dune fields, nearly imperceptible giant ripples, Paleolithic and Neolithic artifacts, and deserted Sudan Defense Force (SDF) and Long Range Desert Group (LRDG) camps1.
Six sand sheet stages of soil formation have been identified, and field studies concentrated on monitoring topographic variations from year to year, as well as repeated orbital images. The uppermost layers are remnants of sediments deposited during the Neolithic pluvial, or rainy periods, of the early Holocene (10-6 kyr). Deeper units have lost their horizontal stratification, and represent much older, more mature soil laid down during the dry intervals of the middle to late Pleistocene (21-16 kyr)1. Below them, calcified pebbles and calcrete represent even older alluvial units, sediments deposited by either groundwater modification of the soils, or ancient lake beds. These units date back to 65-12 ky. These oldest sediments date back to mid-Pleistocene, which was characterized by a wetter, more varied topographic environment. The region went through several dry spells, returned to a less arid climate in the Holocene, and slowly evolved into the hyperarid environment1 that currently exists.
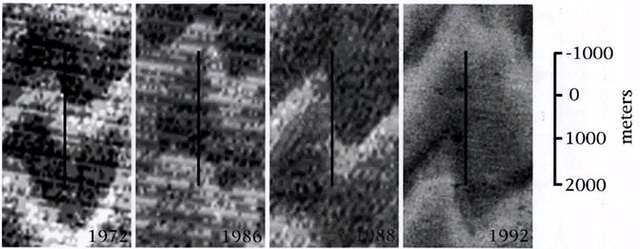
Figure 2. The four near infrared orbital images show the same survey line over time. From left to right the images were taken in 1972, 1986, 1988, and 1992. The zigzag features are the chevron sand features and the different shades correspond to material of different compositions that have different reflectances in the near infrared. The moving of the chevron over time is captured in these remote sensing images.
To fully understand the region's past parameters, we had to quantify the present conditions. We determined the current rate of movement of the chevron sand patterns, shown in Figure 2, to be 500-1000 m/yr and made up 1-5 cm thick units of active sand sheet1. Moreover, the sand transport rates and thickness estimates for the giant ripples seen elsewhere in the sand sheet suggest more rapid movement than that of sand dunes. These measurements suggest a short-term (10s of years) system of equilibrium with the sediment supply and rapid transport across the sand sheet, and a long-term (100s of years) slow vertical accretion controlled by the ripples1. Comparing the data of present and past conditions, indicate the similar processes of erosion and redeposition have been operating on a 1000-yr time scale1.
1. Maxwell, T.A. and C.V. Haynes Jr. (2001), Sand sheet dynamics and Quaternary landscape evolution of the Selima Sand Sheet, southern Egypt. Quaternary Science Reviews, v. 20, p. 1623-1647.
Related Topics
Comments? Contact UsMore Projects
 Research Project
 Research Project
 Research Project
 Research Project