
Financials
Revenues, in Percent, FY 2020
| Contributions & Private Grants | 56.4% | 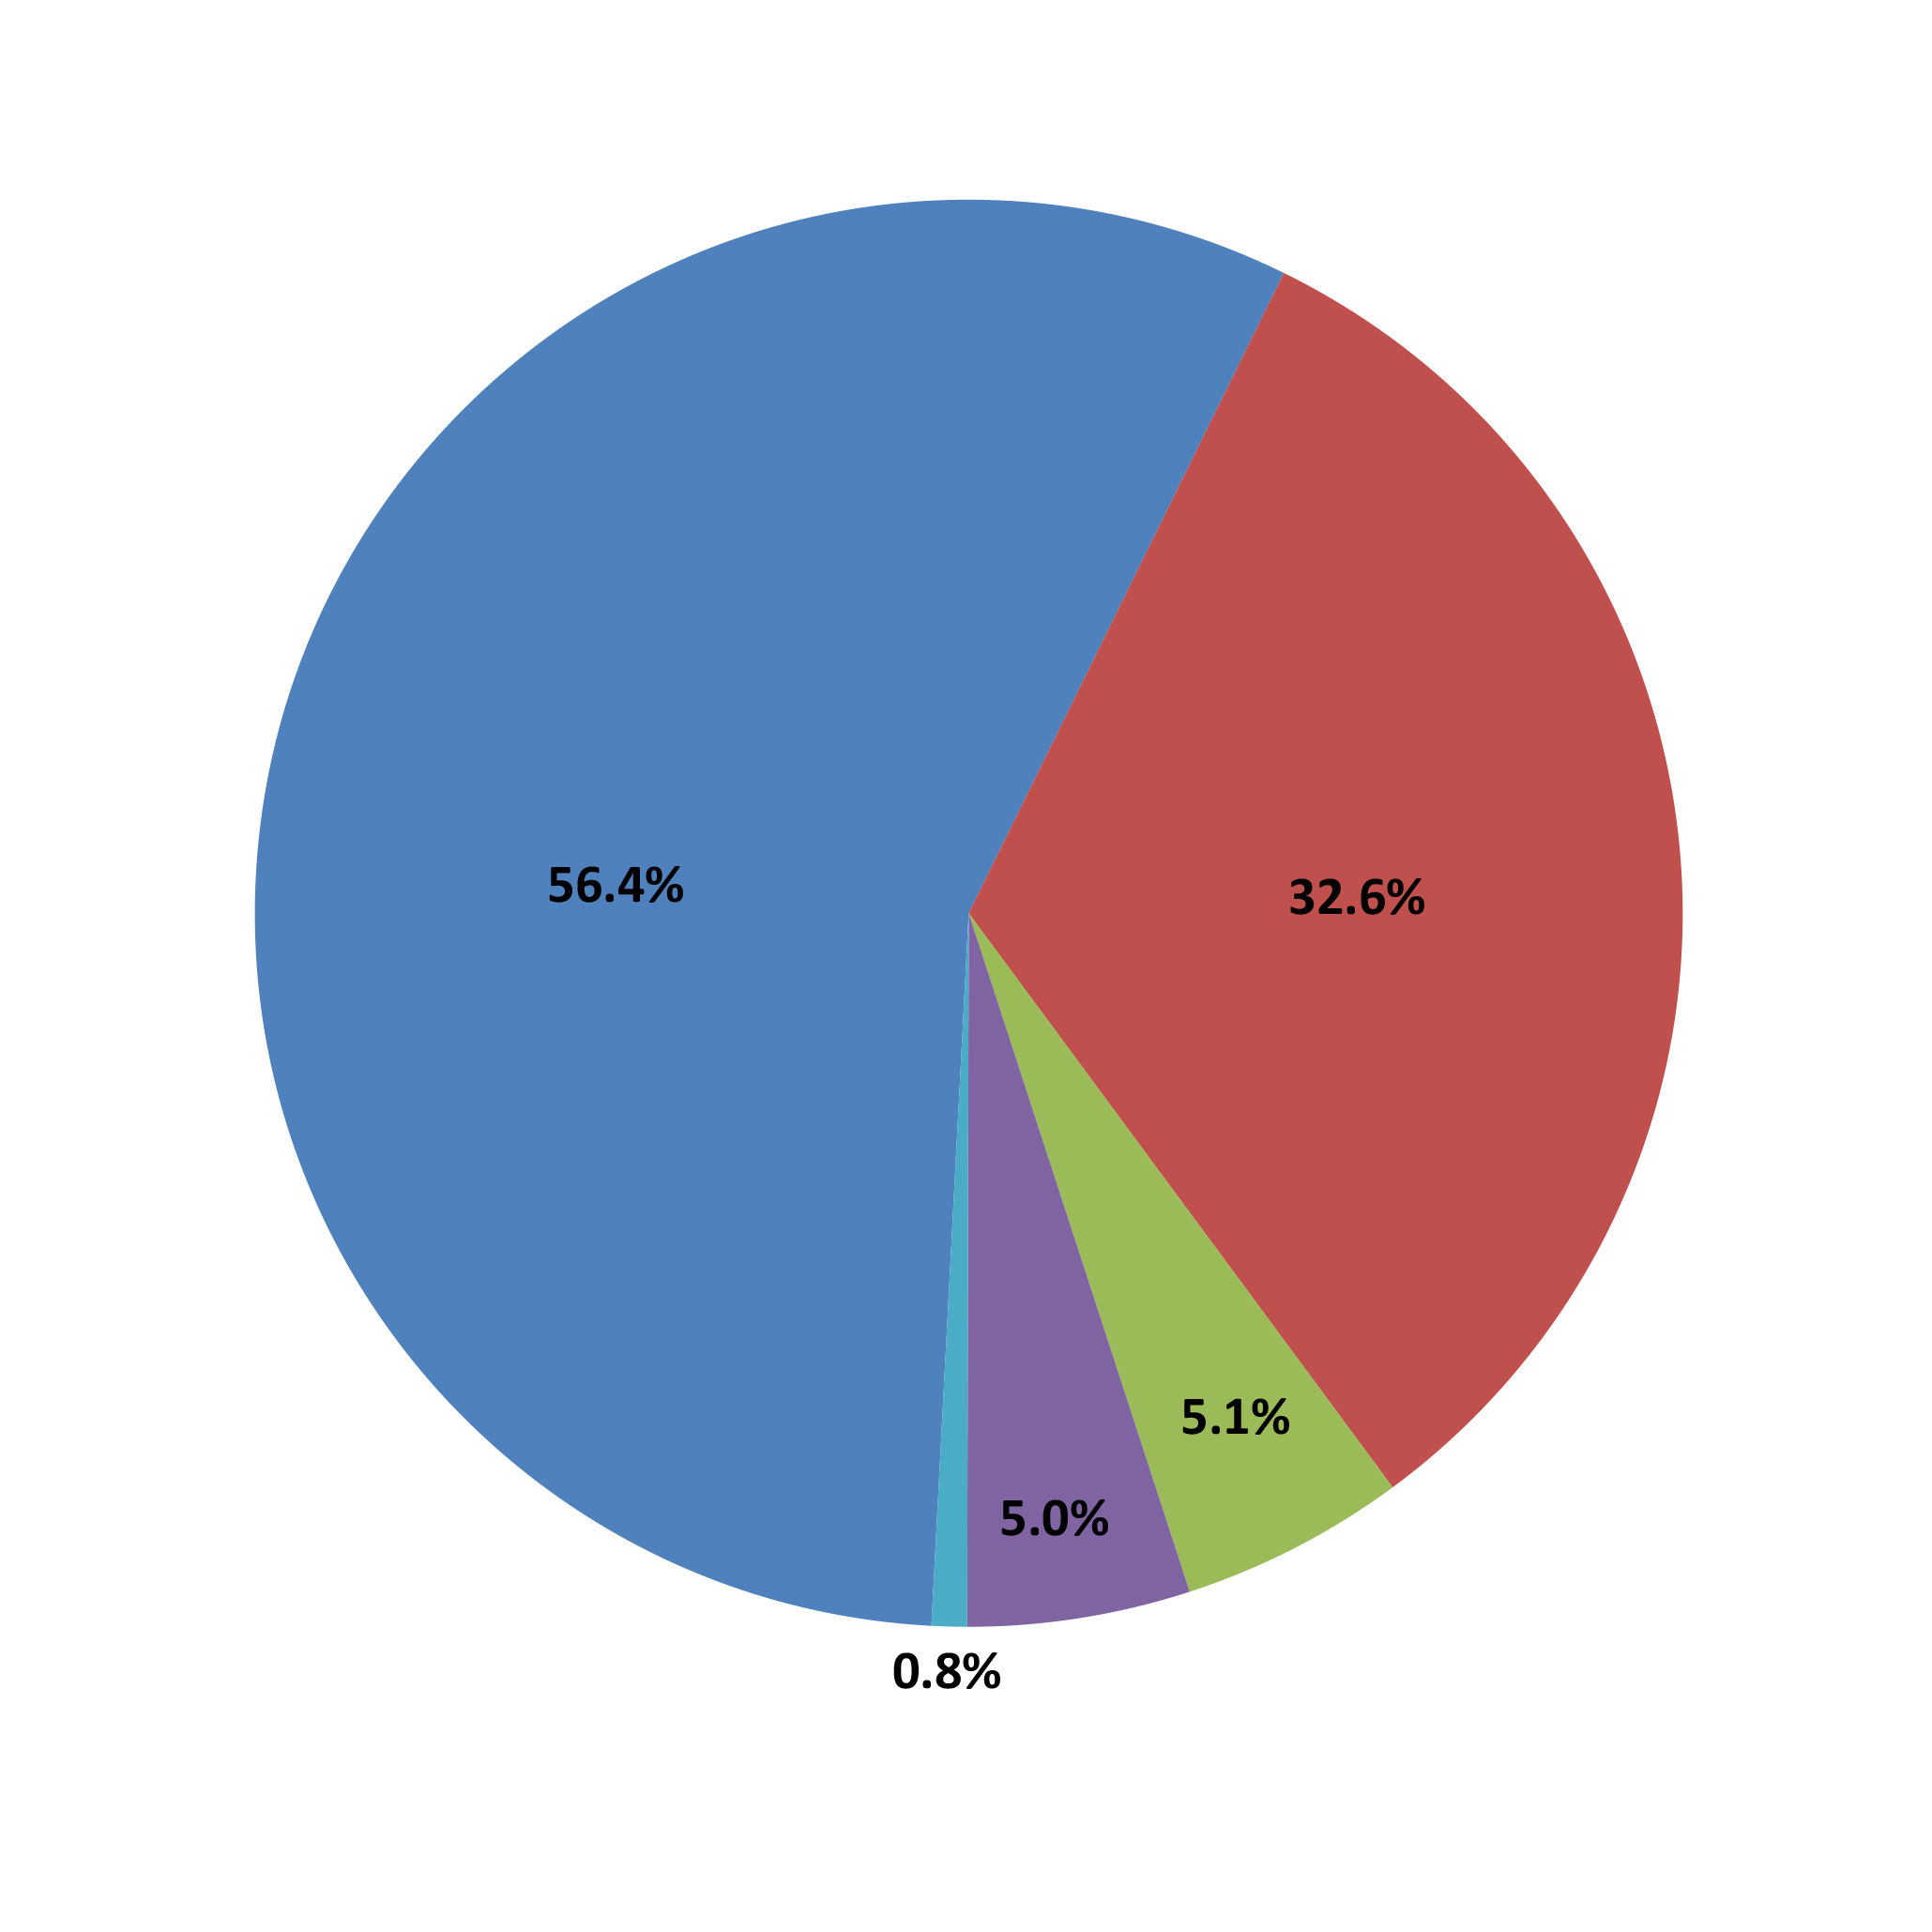 |
| Federal Appropriations | 32.6% | |
| Other (includes Business Income)* | 5.1% | |
| Investment Earnings | 5% | |
| Government Grants & Contracts | 0.8% | |
| Total Revenue | 100.0% |
*Business income generated through Smithsonian Enterprises and includes revenues from parking, restaurants, retail, PD&L and other royalties.
Expenses, in Percent, FY 2020
| Exhibitions | 55.2% | 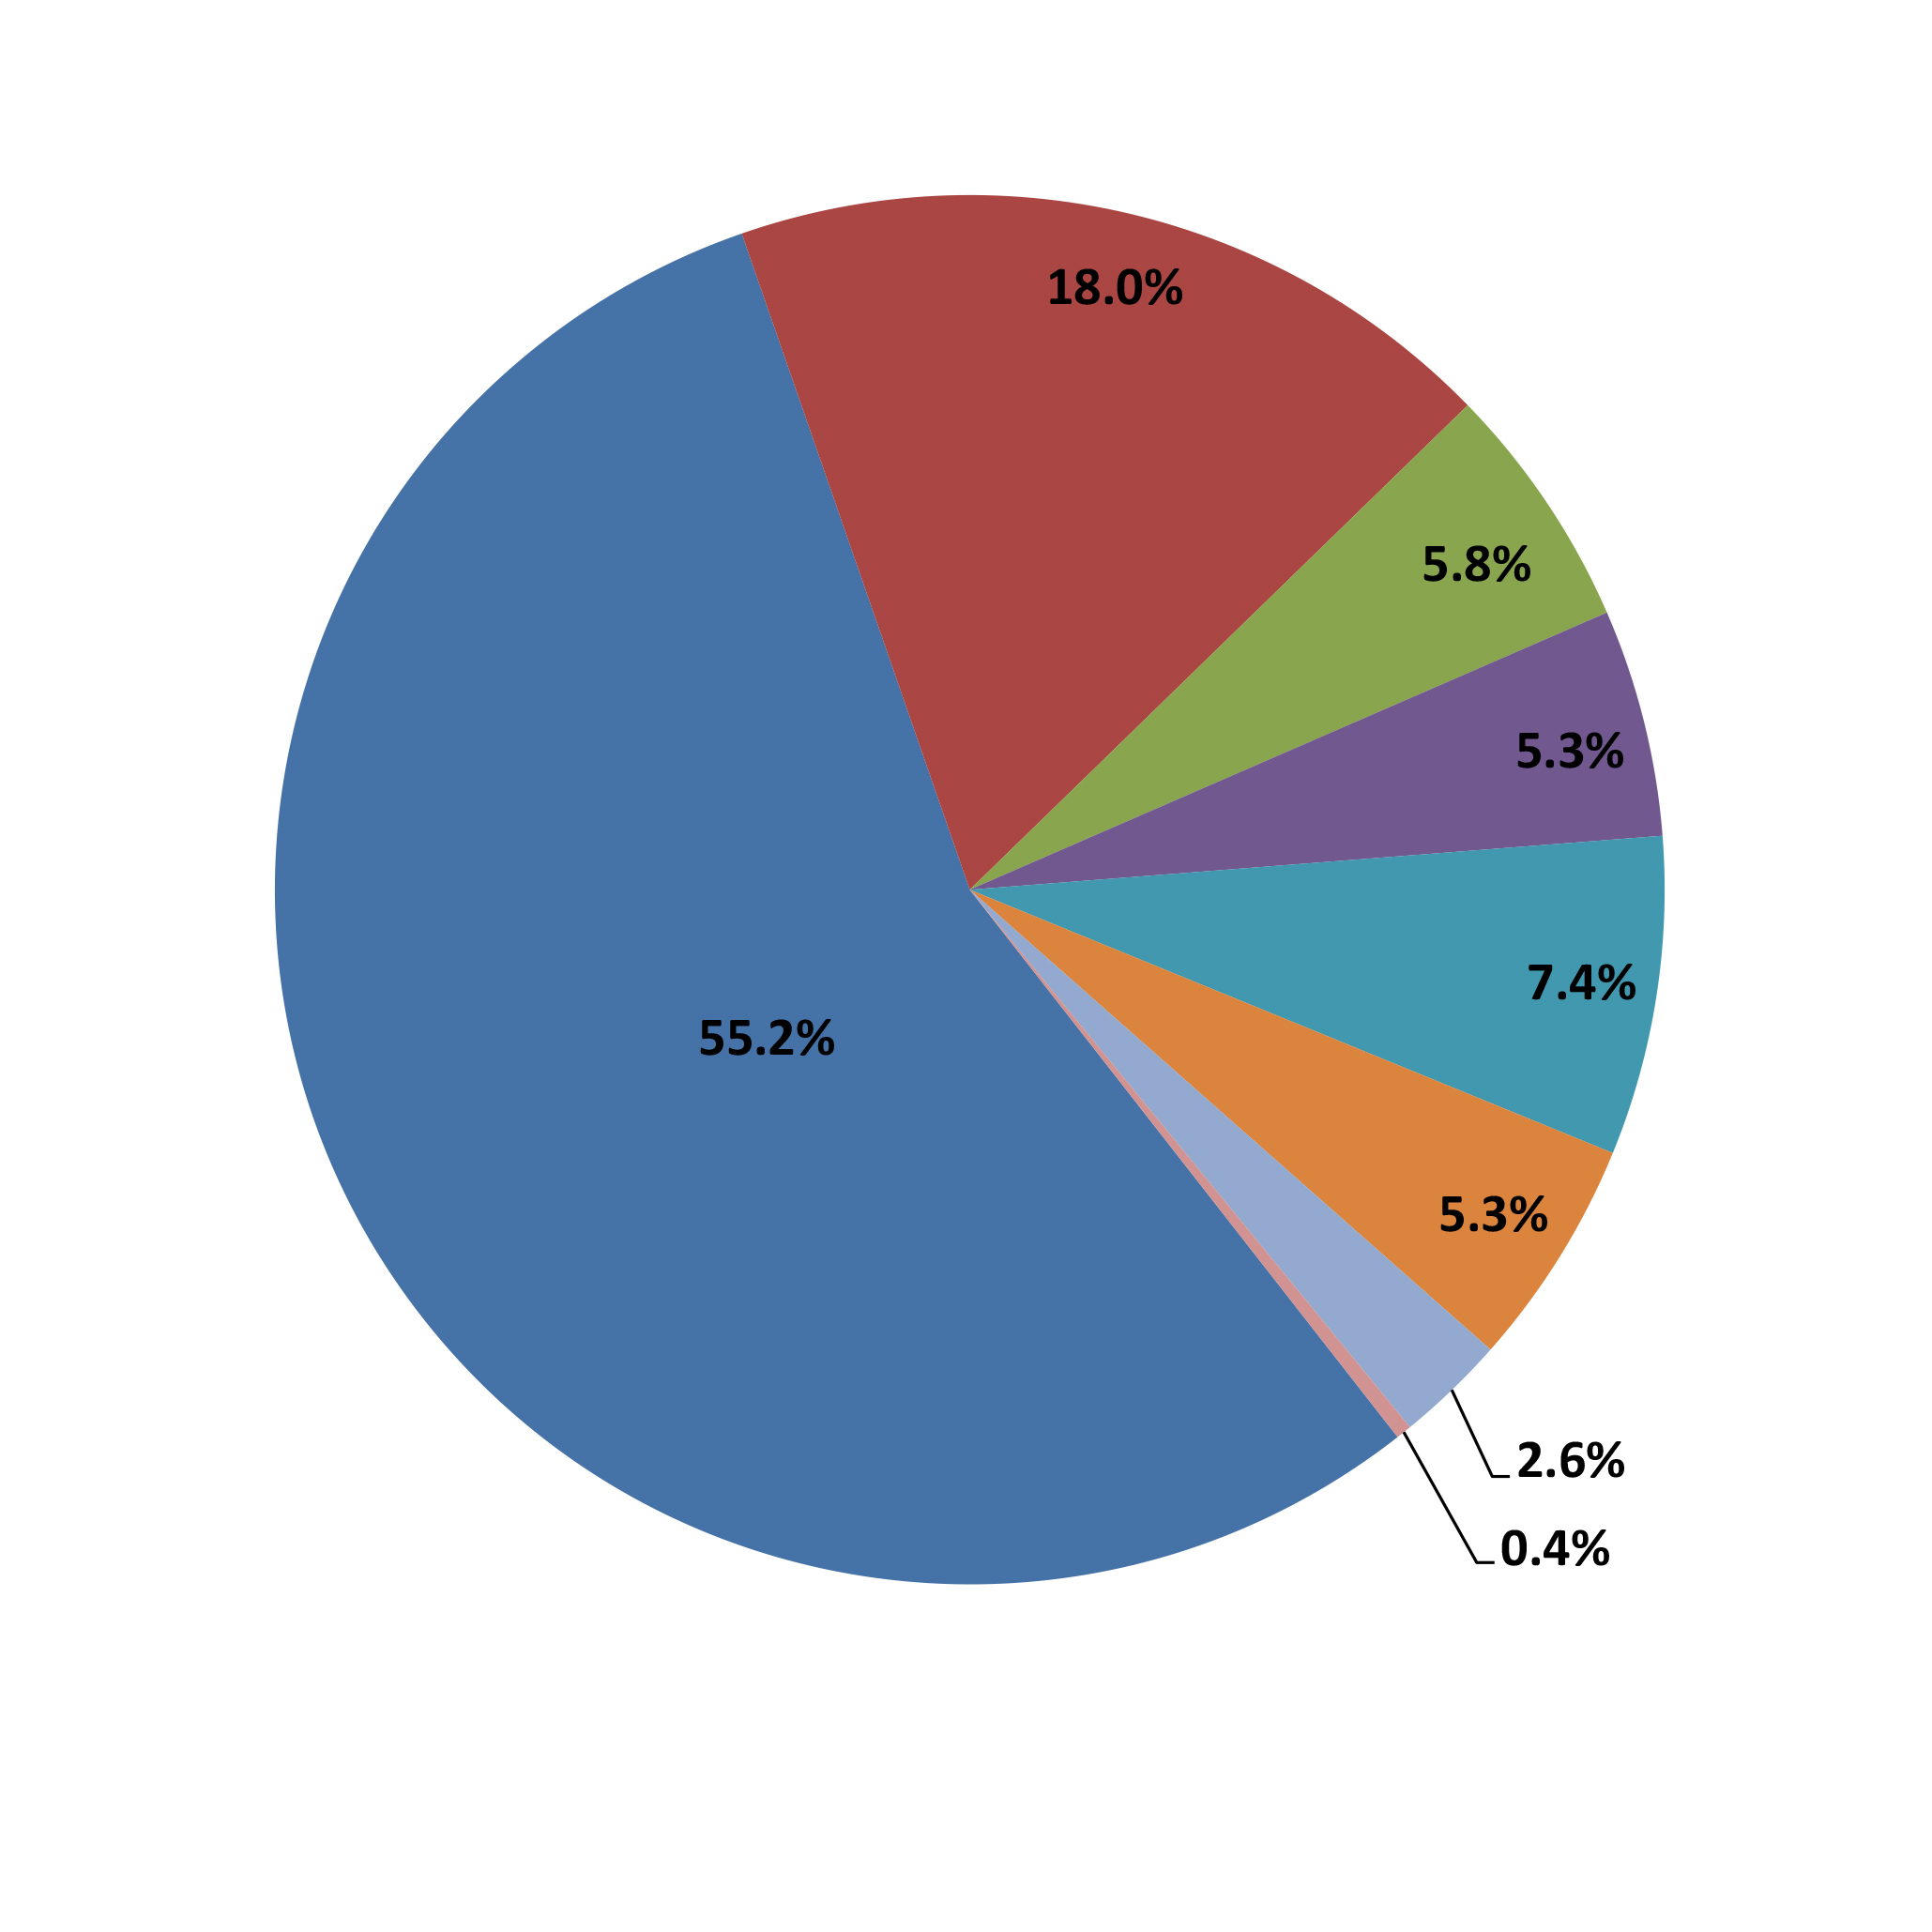 |
| Collections Activity | 18.0% | |
| Research | 5.8% | |
| Public Programs | 5.3% | |
| Management and Operations | 7.4% | |
| Advancement | 5.3% | |
| Information Technology | 2.6% | |
| Facilities | 0.4% | |
| Total Expenses | 100.0% |